Cloudways application logs live under Monitoring → Logs inside the application panel. No SSH or terminal is required to reach them. From login to viewing Access, Error, PHP, and Apache or NGINX logs takes five clicks. The dashboard shows the last 1,000 entries; older entries and real-time tailing need SSH, which is covered below.
This guide walks through the exact path with screenshots, explains which log to open for each error type (502, 403, white screen, slow page), shows how to enable PHP error logging so WordPress errors actually appear, and covers the SSH paths where Cloudways stores the underlying log files.
Quick reference:
- Access Logs: every web request: IP address, URL, HTTP status code, user-agent, response size
- Error Logs: failed requests with Apache or NGINX error lines and stack traces
- PHP Logs: fatal errors, warnings, deprecation notices, and uncaught exceptions from your PHP runtime
- Apache / NGINX Logs: web server events: timeouts, 502s, 504s, upstream failures, configuration warnings
Quick Reference: Which Cloudways Log to Open for Each Error
| Symptom | Log to Check | What to Look For |
|---|---|---|
| 502 Bad Gateway | Apache / NGINX log | upstream timeout, PHP-FPM errors |
| 504 Gateway Timeout | Apache / NGINX log | upstream timed out, keepalive timeout |
| 403 Forbidden | Access log + Error log | 403 status code, file permission error |
| 404 Not Found | Access log | 404 status code, check URL and redirects |
| 500 Internal Server Error | PHP log + Error log | PHP Fatal error, uncaught exception |
| White screen / blank page | PHP log | PHP Fatal error, memory exhaustion |
| Plugin / theme crash | PHP log | Fatal error: Call to undefined function |
| Slow page loads | Access log + PHP log | High response times, slow queries |
| Database connection error | PHP log | Error establishing a database connection |
Step 1 - Log In
Log into your Cloudways dashboard using your credentials.
Step 2 - Target Server
Click the Servers tab in the top menu bar. Choose the server that hosts the application whose logs you want to view.

Step 3 - Access the Application
Click the www icon on the right side of the server row. A dropdown lists every application on that server. Select the application you want to inspect.
Step 4 - Monitoring
In the left navigation panel, click Monitoring to expand its sub-items.
Step 5 - Logs
Click Logs. The panel opens with two top-level views: Access Logs and Error Logs.
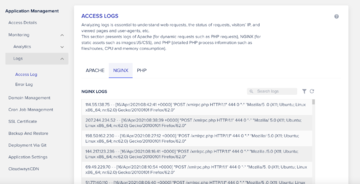
Access Logs show every recent request. A slider lets you pull more than the default view. Above the entry list are tabs for PHP and NGINX (or Apache, depending on your stack). Each tab shows a separate log file with its own search and filter controls.
Error Logs show failed or warning-level requests. The Apache or NGINX error log is where to start when a page returns 502, 503, or 504. The PHP error log is where fatal errors, “call to undefined function” warnings, and stack traces land.
Both panels include a search box for filtering by URL or status code, a refresh button for near-live updates, and a filter row for narrowing by status or message text.
What Each Log Entry Field Means
Reading raw log output is faster once you know what each column represents. A typical Cloudways access log entry looks like this:
203.0.113.45 - - [14/May/2026:09:23:11 +0000] "GET /shop/ HTTP/1.1" 200 54321 "-" "Mozilla/5.0..."
- 203.0.113.45: the visitor’s IP address. Repeated entries from one IP with different URLs indicate normal browsing. Hundreds of requests from one IP within seconds indicate a bot or crawler.
- [14/May/2026:09:23:11 +0000]: the UTC timestamp. Cloudways servers run on UTC; convert to your local time when cross-referencing with a user complaint.
- "GET /shop/ HTTP/1.1": the HTTP method, requested path, and protocol. POST requests on unexpected URLs can indicate a form submission attack or a plugin sending unexpected data.
- 200: the HTTP status code. 200 is success. 301/302 are redirects. 403 is forbidden. 404 is not found. 500/502/503/504 are server errors.
- 54321: response size in bytes. Unusually large responses may indicate unintended data exposure; zero-byte responses on a 200 can indicate a caching misconfiguration.
- "Mozilla/5.0...": the user-agent string. Identifies the browser, bot, or tool making the request.
PHP error log entries follow a different format:
[14-May-2026 09:23:12 UTC] PHP Fatal error: Uncaught Error: Call to undefined function acf_add_options_page() in /home/master/applications/yourapp/public_html/wp-content/plugins/plugin-name/file.php:142
The key fields are the timestamp, error severity, the error message, and the file path with line number.
How to Enable PHP Error Logging on Cloudways
By default, WordPress suppresses PHP errors to protect visitors from seeing raw output. If your PHP error log in the Cloudways dashboard is empty even though the site is broken, PHP error logging is likely off. Here is how to turn it on.
The safest place to enable logging is through the Cloudways Application Settings, not wp-config.php directly. Go to Application → Application Settings → PHP Settings. Set display_errors to Off and log_errors to On. This logs errors to the file without displaying them to site visitors.
If you prefer to enable logging via wp-config.php, add these lines above the /* That’s all, stop editing! */ comment:
define( 'WP_DEBUG', true );define( 'WP_DEBUG_LOG', true );define( 'WP_DEBUG_DISPLAY', false );
WordPress will then write errors to wp-content/debug.log inside your application. You can view this file via SFTP or through the Cloudways File Manager.
Once you have reproduced the error and captured what you need, turn WP_DEBUG back off. Leaving debug mode enabled on a live site exposes file paths and class names in error output if any other path causes PHP to display errors.
Which Cloudways Log to Check for Which Error
Most debugging on Cloudways follows a short list of patterns. Open the right log first and you will save significant time:
- White screen of death / 500 error: check the PHP Error Log first. Look for lines starting with “PHP Fatal error” and note the file path and line number.
- 502 Bad Gateway / 504 Gateway Timeout: check the Apache or NGINX Error Log. Common causes are PHP-FPM workers exhausted, a slow database query holding a connection, or an oversized response body.
- 403 Forbidden: check the Apache or NGINX Error Log. Almost always a file or folder permission issue. See the guide on resetting file and folder permissions on Cloudways to restore the correct defaults.
- 404 on a page that exists: check the Access Log. It confirms whether the request reached your app at all and shows the exact URL that was requested (helpful for trailing-slash or www redirect issues).
- Slow pages with no error: check the Access Log. Sort by response time if available, then cross-reference with the Cloudways performance monitor to identify the slowest endpoints.
- Plugin or theme update failed: check the PHP Error Log immediately after the update timestamp. Fatal errors during activation are logged here.
- WP-Cron jobs not running: check the PHP Error Log for recurring fatal errors during cron execution. A failing cron task often silently blocks all subsequent cron jobs.
- Memory limit errors: PHP Error Log will show “Allowed memory size of X bytes exhausted.” This means a plugin or process is consuming more than the PHP memory limit set in Application Settings.
- Deprecated function notices: PHP Error Log. These are non-fatal but signal plugin or theme code that will break in a future PHP version. If you recently upgraded PHP, expect these to appear.
- WordPress email not sending: check the PHP Error Log for errors from wp_mail() or the mail function. Missing SMTP credentials, blocked outbound port 25, or a misconfigured plugin typically log here. The Access Log will not show email failures since they happen within PHP, not at the HTTP layer.
- WP-Cron consuming excessive memory: look for repeated “Allowed memory size” entries clustering around the same minute each hour. This indicates a scheduled task that is leaking memory. The PHP Error Log timestamps will show the pattern clearly.
Real-Time Log Tailing via SSH
The dashboard refreshes logs periodically but does not offer true live streaming. To tail logs in real time during active debugging, SSH into your Cloudways server and use the tail -f command.
First, get your application folder name from the application’s Access Details tab. Then SSH into the server and run one of the following:
- Live PHP error log:
tail -f /home/master/applications/your-app/logs/php-app.error.log - Live Apache or NGINX error log:
tail -f /home/master/applications/your-app/logs/error.log - Live access log:
tail -f /home/master/applications/your-app/logs/access.log
Replace your-app with your actual application folder name. To tail multiple logs at once, list them all on the same command line after tail -f. Press Ctrl+C to stop.
To search for a specific error pattern in a log file without tailing it live, use grep:
grep "Fatal error" /home/master/applications/your-app/logs/php-app.error.loggrep "502" /home/master/applications/your-app/logs/access.log
Viewing Older Logs Beyond the 1,000-Entry Limit
The dashboard caps each panel at the most recent 1,000 entries. On a busy site that could be less than an hour of traffic. For older entries, SSH or SFTP into the server and read the files directly.
Cloudways stores per-application logs at these paths:
/home/master/applications/your-app/logs/access.log: Apache or NGINX access log/home/master/applications/your-app/logs/error.log: Apache or NGINX error log/home/master/applications/your-app/logs/php-app.error.log: PHP runtime errors/var/log/apache2/or/var/log/nginx/: system-level web server logs, rotated daily
Cloudways rotates application logs daily and compresses older files with gzip. Rotated files appear as access.log.1.gz, access.log.2.gz, and so on. Use zcat or zgrep to read compressed log files without decompressing them first.
Read the walkthrough on finding your application folder name on Cloudways if you are unsure which directory name to use.
For long-term log retention beyond the rotation window, pipe logs to an external service like Papertrail or Logtail using rsyslog. The Cloudways dashboard does not expose this option, but the underlying Linux server supports it like any VPS.
How to Manage Log File Size on Cloudways
Cloudways rotates logs daily automatically, but on high-traffic sites or during a sustained error storm, log files can grow large enough to consume meaningful disk space within hours. A few practical steps:
- Check current log sizes: SSH in and run
du -sh /home/master/applications/your-app/logs/*to see the size of each log file. - Truncate without deleting: if a log is consuming too much space, run
truncate -s 0 /home/master/applications/your-app/logs/php-app.error.log. This empties the file without removing it, so the process writing to it continues uninterrupted. - Do not delete the log file itself: deleting an active log file can cause the web server process to lose its file handle, requiring a restart. Truncate instead of delete.
- Fix the underlying issue: a log growing at hundreds of MB per day almost always means a recurring error is firing on every request. Identify and fix the root cause rather than rotating the log repeatedly.
Application Logs vs Server Logs on Cloudways: Which to Check First
Cloudways exposes two distinct levels of logs and knowing which to open first saves time during a live incident. The quick rule: if the issue affects one site, start with application logs. If the issue affects all sites on the server or involves a server restart, start with server logs.
Application-Level Logs
Application logs (the ones covered in this guide) record activity specific to a single application. They live at Application > Monitoring > Logs and show:
- error.log: PHP errors, WordPress debug output, and application-level warnings for this site only
- access.log: HTTP requests handled by this application (request paths, response codes, IP addresses)
- nginx-error.log / apache-error.log: web server errors for this application, including 502 and 504 entries
If only one site is broken, start here. A 502 on a single application while other sites on the same server work normally is almost always an application-level issue visible in nginx-error.log or error.log.
Server-Level Logs
Server logs capture infrastructure events that affect all applications on the server. You access them via SSH rather than the dashboard. The main server logs are:
/var/log/syslogor/var/log/messages: operating system events, kernel messages, service starts and stops/var/log/mysql/error.log: MySQL server errors, which affect all applications if the database service goes down/var/log/auth.log: SSH login attempts and authentication events at the server level
Start at the server level when all applications on a server go down simultaneously, when you need to investigate repeated failed SSH login attempts, or when MySQL errors are affecting multiple sites. For most single-application issues (plugin errors, 404s, 503s on one site), the application logs accessed from the dashboard are sufficient and faster to reach.
Quick Reference: Common Cloudways Log Error Messages
The following entries appear frequently in Cloudways error logs. Knowing what they indicate speeds up diagnosis:
- 502 Bad Gateway: The web server (NGINX or Apache) received no valid response from the PHP-FPM process. Common causes include a PHP timeout, exhausted memory limit, or a fatal PHP error. Check the PHP log tab for a fatal error entry with the same timestamp.
- 504 Gateway Timeout: PHP took too long to respond. Often caused by a slow external HTTP call, a long-running database query, or a plugin processing a large dataset. Use the Kinsta APM equivalent on Cloudways or check the access log for the URL that timed out.
- 403 Forbidden: A file permission or ownership mismatch is blocking access. Check the error log for the exact path, then reset permissions via SSH or the Cloudways file manager. The most common case is a plugin writing files with root ownership instead of the web server user.
- PHP Fatal error: Allowed memory size exhausted: A PHP process exceeded the memory_limit setting. Increase PHP memory in Application → Application Settings → PHP Settings, or identify and fix the plugin causing the spike.
- PHP Warning: Cannot modify header information: Output was sent to the browser before the HTTP headers were flushed. Usually caused by whitespace or a BOM character before a PHP opening tag, or a plugin echoing output too early.
- Upstream timed out (110: Connection timed out): NGINX could not reach the PHP-FPM socket within the configured timeout. Restart PHP-FPM from the Cloudways dashboard (Application → Application Settings) or scale the server if PHP worker processes are saturated.
Searching and Filtering Cloudways Logs
The Cloudways dashboard log viewer shows the most recent 1,000 log entries. Use your browser's find (Ctrl+F / Cmd+F) for quick searches within the visible entries. For filtering by date, status code, or error type, SSH into the server and use Linux tools on the log files directly.
The dashboard includes a search box above each log panel for quick in-browser filtering. Type 502 to show only 502 responses, /wp-admin to isolate requests to a specific path, a suspect IP address to see all requests from that visitor, or Fatal in the PHP log to show only fatal errors.
Common SSH search commands:
- Filter by status code (500 errors):
grep " 500 " /home/master/applications/your-app/logs/access.log - Filter by hour:
grep "14/Jun/2026:10:" /home/master/applications/your-app/logs/access.log - Show only PHP fatal errors:
grep "PHP Fatal" /home/master/applications/your-app/logs/php-app.error.log - Last 50 error log lines:
tail -n 50 /home/master/applications/your-app/logs/error.log
Replace your-app with your application folder name, shown in Cloudways under Application Management. These commands work across all Cloudways stacks (Apache, NGINX, or Nginx + Apache).
Why Is Your Cloudways Error Log Empty?
If you open the Cloudways log viewer and the PHP error log tab is blank even though something is clearly wrong with the site, one of these four causes is usually responsible.
- PHP error logging is turned off. WordPress suppresses errors by default to avoid showing raw output to visitors. Go to Application → Application Settings → PHP Settings and confirm that
log_errorsis set to On. If it is off, errors are discarded rather than written to the log file. - Errors are going to wp-content/debug.log instead. If your wp-config.php has
define( ‘WP_DEBUG_LOG’, true );but does not specify a path, WordPress writes errors towp-content/debug.lograther than the PHP runtime error log that Cloudways displays in the dashboard. Read that file via SFTP or the Cloudways File Manager. You can also setdefine( ‘WP_DEBUG_LOG’, ‘/home/master/applications/your-app/logs/php-app.error.log’ );to redirect WordPress debug output into the file the dashboard shows. - The dashboard is showing a cached view. The Cloudways log panel does not auto-refresh. Click the refresh icon in the log panel or reload the page after triggering the error again. On busy sites the 1,000-entry cap may also push older errors out of view; switch to SSH and read the file directly if you need to scroll further back.
- No errors have actually occurred yet. If the site appears broken but the log is clean, the problem may be at the DNS or server level rather than the application layer. Check the Apache or NGINX error log tab (separate from the PHP tab) for 502, 504, or connection-refused messages. Also check the Cloudways server monitoring panel for CPU or RAM spikes that could be causing PHP-FPM to reject new connections without logging an application-level error.
Final Word: How to View Application Logs on Cloudways
Cloudways log viewing is fast from the dashboard: five clicks reaches Access, Error, PHP, and web server logs in a single panel with search and filtering on every tab. For deeper debugging, enable PHP error logging through Application Settings or wp-config.php, then tail the log files live over SSH. The two limits to keep in mind are the 1,000-entry dashboard cap (drop to SSH for older data) and the daily log rotation (use zcat for compressed archives).
If the logs show a 403 Forbidden or Permission Denied error, you likely need to reset file and folder permissions on Cloudways to restore the defaults.
For a broader look at what the platform offers, see our Cloudways review, or sign in to your Cloudways dashboard to try the log viewer.